Benchmarking: Bond - Santa Rita
Contents
Benchmarking: Bond/Barratt Specific Energy Consumption - Santa Rita
Latchireddi, S. & Faria, E., Achievement of High Energy Efficiency in Grinding Mills at Santa Rita, Proceedings of the Canadian Mineral Processors Annual General Meeting, Ottawa, Canada, January 2013.
Faria, E. & Latchireddi, S., Commissioning and Operation of Milling Circuit at Santa Rita Nickel Operation, Paper #137: Proceedings of the International Autogenous Grinding, Semiautogenous Grinding and High Pressure Grinding Roll Technology Conference, Vancouver, Canada, September 2011.
Design Criteria
A survey was conducted on July 15, 2010 and reported the following:
- Ore A×b 50.2
- Ore ball mill work index 18.4 kWh/tonne
- Circuit FAG mill feed F80 141 mm
- Circuit cyclone overflow P80 146 µm
- SAG mill: 30 foot diameter by 15.4 foot effective grinding length (EGL)
- Ball mill: one 20 foot by 28.4 foot EGL
To run the Bond/Barratt model requires work index values for rod milling and crushing. The reported A×b (50.2) is similar to these values:
- WiRM 15.0 kWh/tonne
- WiC 15.0 kWh/tonne
The motors are not described in detail, but the paper does mention a problem with "SER", which usually stands for "slip energy recovery", suggesting that the SAG mill uses a gear drive with an induction motor. Assume that the ball mill also has an induction motor with gear drive, so for both mills use 0.97 for mechanical efficiency between the motor output and the mill shell, and a motor efficiency of 0.96 between the motor input and output.
Model parameter fitting
The following tables back-calculate the "Essbm contingency" model fitting parameter for the Bond/Barratt SABC model (which includes allowance for phantom cyclone effects). Specific energy references the "mill shell" kW values (note that specific energy values in the references relate to power at the DCS).
| FAG | BM | Peb Crusher | Etotal | |
|---|---|---|---|---|
| DCS kW | 6,667 | 5,082 | ||
| Shell kW | 6,208 | 4,732 | 224 | |
| Throughput, t/h | 650 | 650 | 650 | |
| Specific Energy, kWh/t | 9.55 | 7.28 | 0.34 | 17.18 |
| Essbm | 16.82 | |||
| contingency | 2.1% |
The default model contingency is 10%, so this circuit is operating more efficiently. Note that the lack of actual work index measurements in the rod mill and crushing size classes means there is uncertainty in the Essbm measurement used to estimate the contingency.
Circuit Simulation
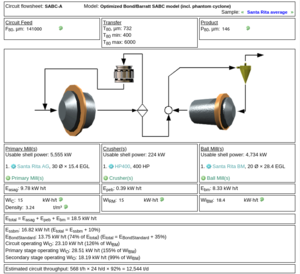
Combining the Bond/Barratt specific energy model, the Austin FAG model described in the bibliography and the Nordberg wet overflow ball mill model described in the bibliography results in the following throughput predictions using the work index values above:
- Actual FAG/ball motor powers (at shell): 6,208 kW / 4,732 kW
- Actual daily average throughput: 650 tonnes/hour
- Predicted FAG/ball motor powers (at shell): 5,555 kW / 4,734 kW
- Predicted nominal throughput: 568 tonnes/hour (14.4% difference)
Additional criteria for modelling:
- SAG mill loading 33.18% v/v (autogenous, no balls)
- ball mill loading 27.5% v/v
- DCS to shell conversion 0.97 × 0.96 = 0.9312
- SAG liner thickness not given, assume 4.5 inches
- circuit F80 141 mm; P80 146 µm
| FAG | BM | Pebble Crusher |
total | |
|---|---|---|---|---|
| Measured specific energy consumption, kWh/t | 9.55 | 7.28 | 0.34 | 17.18 |
| Predicted specific energy consumption, kWh/t | 9.78 | 8.33 | 0.39 | 18.50 |
| Difference, kWh/t | 0.23 | 1.05 | 0.05 | 1.32 |
| Difference, % | 2.4% | 14.4% | 14.7% | 7.7% |
The model specific energy consumption estimates are 7.7% higher than the actual values, and the mill model power draw estimates are about 6% lower than actual. The net effect is the throughput estimates are 14% lower for the model versus the survey.
