Difference between revisions of "Loveday/Barratt SAG model"
(→Model Form) |
|||
| (2 intermediate revisions by the same user not shown) | |||
| Line 1: | Line 1: | ||
| + | [[category:Models]] |
||
| + | [[category:Mill power draw models]] |
||
==History== |
==History== |
||
[[Bibliography:_Mill_power_draw_models|Brian Loveday (1978)]] published a scale-up procedure for autogenous pilot plant power draw to industrial sized machines that used an empirical ''power number'' to encompass all the motion effects of a mill charge. [[Bibliography:_Mill_power_draw_models|Derek Barratt (2002)]] derived a set of power numbers for industrial machines for use in Loveday's base formula, where a power number for a particular mill filling and speed are read from a chart and then charge density, including the ball load, are fed into Loveday's formula to predict SAG mill power draw. |
[[Bibliography:_Mill_power_draw_models|Brian Loveday (1978)]] published a scale-up procedure for autogenous pilot plant power draw to industrial sized machines that used an empirical ''power number'' to encompass all the motion effects of a mill charge. [[Bibliography:_Mill_power_draw_models|Derek Barratt (2002)]] derived a set of power numbers for industrial machines for use in Loveday's base formula, where a power number for a particular mill filling and speed are read from a chart and then charge density, including the ball load, are fed into Loveday's formula to predict SAG mill power draw. |
||
| Line 32: | Line 34: | ||
==Power Number Nomograph== |
==Power Number Nomograph== |
||
[[File:Barratt2002-PowerNumbers.png]] |
[[File:Barratt2002-PowerNumbers.png]] |
||
| + | |||
| + | source: [[Bibliography:_Mill_power_draw_models|Barratt & Sherman (2002)]] |
||
| + | |||
| + | ==Discusion== |
||
| + | The paper [https://www.sagmilling.com/articles/20/view/?s=1|A comparison of SAG mill power models] published by Doll at Procemin 2013 suggests that this model predicts power draw about 10% high when the mill speed is below about 78% of critical. This model is not recommended for doing throughput or mill sizing calculations, but is a conservative (good) model to use when selecting the motor size for a mill. |
||
Latest revision as of 14:27, 23 April 2014
History
Brian Loveday (1978) published a scale-up procedure for autogenous pilot plant power draw to industrial sized machines that used an empirical power number to encompass all the motion effects of a mill charge. Derek Barratt (2002) derived a set of power numbers for industrial machines for use in Loveday's base formula, where a power number for a particular mill filling and speed are read from a chart and then charge density, including the ball load, are fed into Loveday's formula to predict SAG mill power draw.
The power numbers that Barratt published are based on mills with 'typical' cone-ends (probably 15° to 25°). A flat-ended (shell-supported) mill is expected to have 5% less power draw.
Model Form
Loveday's equation is:

Where:
- P is the power evolved at the mill shell, kW
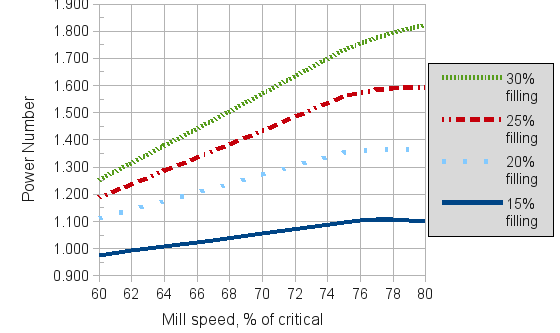
- PN is the empirical power number read from the chart below
- D is the mill diameter inside the effective liner thickness, m
- L is the mill effective grinding length (or 'belly length'), m
- ρcharge is the density of the mill charge, including balls, rocks and slurry, t/m3
The formula for ρcharge is as follows:
![\rho_{charge} = \left[\tfrac{J_{balls}}{J_{total}} \rho_{balls} + \tfrac{J_{ore}}{J_{total}} \rho_{ore} \right] \times \left( 1- J_{voids} \right) + J_{voids} \rho_{pulp}](/images/math/7/8/d/78d322f54f9ae3274998eb9def79b822.png)
Where:
- Jtotal is the fractional mill volumetric filling (eg. 0.30 for 30%)
- Jballs is the fractional volumetric filling of balls (eg. 0.10 for 10%)
- Jore is the fractional volumetric filling of coarse ore (eg. Jtotal - Jballs)
- Jvoids is the fractional volumetric void space between rocks and balls (use 0.4)
- ρballs is the density of the grinding balls, t/m3
- ρore is the density of the ore, t/m3
- ρpulp is the density of the pulp, excluding rocks and balls, t/m3
Power Number Nomograph
source: Barratt & Sherman (2002)
Discusion
The paper comparison of SAG mill power models published by Doll at Procemin 2013 suggests that this model predicts power draw about 10% high when the mill speed is below about 78% of critical. This model is not recommended for doing throughput or mill sizing calculations, but is a conservative (good) model to use when selecting the motor size for a mill.
