Difference between revisions of "Benchmarking: Bond - Copper Mountain"
(→Model Tuning) |
(→Modelling) |
||
| (3 intermediate revisions by 2 users not shown) | |||
| Line 59: | Line 59: | ||
===Modelling=== |
===Modelling=== |
||
| − | [[file: |
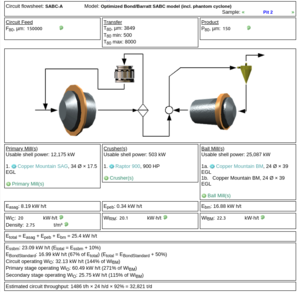
+ | [[file:CopperMtn-pit2.png|thumb|Screenshot of pit 2 model]] |
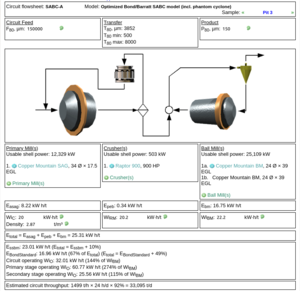
| + | [[file:CopperMtn-pit3.png|thumb|Screenshot of pit 3 model]] |
||
* Assume the crushing work index is similar to the rod mill: 20 (metric). |
* Assume the crushing work index is similar to the rod mill: 20 (metric). |
||
* Default SSBM contingency for SABC circuit is 0.10. |
* Default SSBM contingency for SABC circuit is 0.10. |
||
* Assume liner thickness of 6 inches in SAG, 4.5 inches in ball mill. |
* Assume liner thickness of 6 inches in SAG, 4.5 inches in ball mill. |
||
| − | * Model predicted throughput: |
+ | * Model predicted throughput: 1499 t/h on Pit 3 ore and 1488 t/h on Pit 2 ore. |
Result for default model conditions: |
Result for default model conditions: |
||
{| class="wikitable" border="1" |
{| class="wikitable" border="1" |
||
|- |
|- |
||
| + | ! !! Pit 2 !! Pit 3 |
||
| − | ! |
||
| − | ! Tonnage |
||
|- |
|- |
||
| − | | Model |
+ | | Model || 1488 t/h || 1499 t/h |
| − | | 1455 t/h |
||
|- |
|- |
||
| − | | Measured |
+ | | Measured || 1600 t/h || 1600 t/h |
| − | | 1600 t/h |
||
|- |
|- |
||
| − | | Difference |
+ | | Difference || 112 t/h || 101 t/h |
| − | | 145 t/h |
||
|- |
|- |
||
| − | | Difference |
+ | | Difference || 7% || 6.3% |
| − | | 9.5% |
||
|} |
|} |
||
| Line 92: | Line 88: | ||
* Raising the SAG speed to 78% of critical speed (10.4 RPM) has little effect due to the drop-off in power observed in a Loveday model using Barratt's published <i>Power Numbers</i> above 76% of critical speed. |
* Raising the SAG speed to 78% of critical speed (10.4 RPM) has little effect due to the drop-off in power observed in a Loveday model using Barratt's published <i>Power Numbers</i> above 76% of critical speed. |
||
* The model predicts a '''negative''' phantom cyclone effect. This is an odd result, but does match one observation on a hard ore (Boddington circuit; private communication with M. Sherman). |
* The model predicts a '''negative''' phantom cyclone effect. This is an odd result, but does match one observation on a hard ore (Boddington circuit; private communication with M. Sherman). |
||
| − | |||
| − | ===Model Tuning=== |
||
| − | The Bond/Barratt model is tuned using a contingency on the Single Stage Ball Mill specific energy consumption estimate (E<sub>ssbm</sub>). |
||
| − | |||
| − | * The SSBM contingency factor would be back-calculated as 0.01 based on the data set above. |
||
| − | |||
| − | |||
| − | Changing the SAG mill to the simplified Morrell model results in a much lower mill power draw estimate: 82.8% of rated output. This is much too low and this mill must be modelled with a higher ''k-factor''; likely between 1.35 and 1.40. Unfortunately, without actual motor power measurements, this factor cannot be tuned. |
||
| − | |||
| − | Changing the SAG mill to the Austin model results in a lower mill power draw estimate: 78.4% of rated output. This is also unlikely and the mine would be operating at a higher power draw than the Austin model predicts. The lower SAG power draw drives the T80 estimate very coarse, roughly 10 mm. The predicted throughput is about 5% lower than using the Loveday/Barratt SAG model. |
||
Latest revision as of 18:13, 20 May 2020
Contents
Benchmarking: Bond/Barratt - Copper Mountain
2011 SAG Conference, Mill & Motor
van de Vijfeijken, M., Filidore, A., Walbert, M. and Marks, A., Copper Mountain: Overview on the Grinding Mills and their Dual Pinion Mill Drives. Proceedings of the SAG 2011 Conference, September 25-28, 2011; Vancouver, Canada.
- SAG mill inside (shell) diameter: 34 ft (10.363 m)
- SAG mill effective grinding length: 17.5 ft (5.334 m)
- SAG mill design speed (corresponding to motor peak torque/power): 10.08 RPM
- SAG mill motor (original) power output: 17,000 HP (12,677 kW)
- Ball mill inside (shell) diameter: 24 ft (7.315 m)
- Ball mill effective grinding length: 39 ft (11.886 m)
- Ball mill design speed (corresponding to motor peak torque/power): 11.89 RPM
2011 SAG Conference, Process Design
Marks, A., Sams, C. and Major, K., Grinding Circuit Design for Similco Mines. Proceedings of the SAG 2011 Conference, September 25-28, 2011; Vancouver, Canada.
| Sample | Density, g/cm3 | A×b | ta | WiRM | WiBM |
|---|---|---|---|---|---|
| Pit 2 | 2.75 | 22.9 | 0.19 | 20.1 | 22.3 |
| Pit 3 | 2.87 | 20.1 | 0.16 | 20.2 | 22.2 |
- Circuit F80: 150 mm
Presentation to District 6 CMP
Morrison, R., Current Plant Conditions at Copper Mountain. Presentation to the BC/Yukon Branch Canadian Mineral Processors, November 29, 2012; Vancouver, Canada.
- Ore blend is 80% Pit 3; 20% Pit 2.
- SAG mill motors have been upgraded to total 13.8 MW by adding cooling to drive transformers (6.9 MW per motor).
- SAG mill operating with 17% v/v ball charge and 27% to 28% v/v total filling
- SAG mill operating typically 10.2 RPM.
- Ball mills operating 34% to 35% v/v total filling
- Circuit P80=150 µm (was 180 µm before SAG motor upgrade)
- Circuit throughput: 1600 t/h
Modelling
- Assume the crushing work index is similar to the rod mill: 20 (metric).
- Default SSBM contingency for SABC circuit is 0.10.
- Assume liner thickness of 6 inches in SAG, 4.5 inches in ball mill.
- Model predicted throughput: 1499 t/h on Pit 3 ore and 1488 t/h on Pit 2 ore.
Result for default model conditions:
| Pit 2 | Pit 3 | |
|---|---|---|
| Model | 1488 t/h | 1499 t/h |
| Measured | 1600 t/h | 1600 t/h |
| Difference | 112 t/h | 101 t/h |
| Difference | 7% | 6.3% |
Discussion
- It is noted that the SAG mill model is drawing less than 92% of available power and the ball mill model is drawing over 95%. Power measurements for these mills haven't been published to check against the model.
- The ball mills are likely operating at close to this power draw.
- The SAG mill actual power draw (measured at the shell) is most probably higher than 92%.
- The liner effective thickness is unknown and may be thinner than assumed — this would increase the power draw in the mills and increase the tonnage. Changing the effective liner thickness of the SAG mill to 4.5 inch and the ball mills to 3.0 inches results in 1490 t/h throughput prediction (7.1% difference versus the measured throughput).
- The assumed crushing work index (20) suggests a very competent ore compared to most in British Columbia — this matches comments at the SAG conference. Assuming a lower work index of 10 results in a throughput of 1505 t/h (6.1% difference versus the measured throughput).
- Raising the SAG speed to 78% of critical speed (10.4 RPM) has little effect due to the drop-off in power observed in a Loveday model using Barratt's published Power Numbers above 76% of critical speed.
- The model predicts a negative phantom cyclone effect. This is an odd result, but does match one observation on a hard ore (Boddington circuit; private communication with M. Sherman).

