Difference between revisions of "Benchmarking: BondBarratt - Detour Lake"
(→Discussion) |
(→Discussion) |
||
| (3 intermediate revisions by the same user not shown) | |||
| Line 33: | Line 33: | ||
* Wi<sub>RM</sub> use 50<sup>th</sup> percentile = 18.0 kWh/tonne. |
* Wi<sub>RM</sub> use 50<sup>th</sup> percentile = 18.0 kWh/tonne. |
||
* Wi<sub>C</sub> use 50<sup>th</sup> percentile = 14.8 kWh/tonne. |
* Wi<sub>C</sub> use 50<sup>th</sup> percentile = 14.8 kWh/tonne. |
||
| − | * Plant availability = |
+ | * Plant availability = 87% |
Mill criteria |
Mill criteria |
||
| Line 105: | Line 105: | ||
If we claim that 7% difference between April/May and the 2015 data, then the differences become: |
If we claim that 7% difference between April/May and the 2015 data, then the differences become: |
||
| − | * Etotal : model 7% low |
+ | * Etotal : actual = 19.5 kWh/t, model 7% low |
| − | * t/h : model 13% high |
+ | * t/h : actual = 2700 t/h, model 13% high |
The ultimate capacity of this circuit hasn't been established yet, so it could very likely continue to improve and approach the model numbers. |
The ultimate capacity of this circuit hasn't been established yet, so it could very likely continue to improve and approach the model numbers. |
||
| − | Trying the Raw Bond/Barratt model, the model predicts: |
+ | Trying the Raw Bond/Barratt model and comparing to the April/May 2015 values, the model predicts: |
| − | * Etotal : |
+ | * Etotal : 18.3 kWh/t, model 1% high |
| − | * t/h : |
+ | * t/h : 2992 t/h, model 2% high |
Latest revision as of 03:12, 5 November 2015
Contents
Benchmarking: Bond/Barratt SAG Mill Specific Energy Consumption - Detour Lake
- J. Torrealba-Vargas, J.-F. Dupont, J. McMullen, A. Allaire and R. Welyhorsky, The successful development of the detour lake grinding circuit: from testwork to production. Proceedings of the SAG 2015 Conference, September 2015, Vancouver, Canada, Paper 38.
Operating data from 2015, A×b looks similar to 50th percentile from the October 2012 NI43-101 report.
"Current value" data, table 7 from the reference
- Throughput = 2×1,258 = 2,516 dry tonnes per hour
- SAG circuit F80 = 90.7 mm (pre-crusher product)
- circuit P80 = 90 µm
- SAG power draw (at motor input, per mill) = 13,424 kW (at mill shell = 12,694 kW)
- SAG mill ball charge = 17 % vol
- SAG mill total charge = 24.3 % vol
- SAG mill discharge % solids = 70% weight
- SAG mill speed 80.24% of critical
- ESAG at mill shell = (2×12,694)/2,516 = 10.1 kWh/t
- pebble crushers typically draw 322 kW
- Epeb = (2×322)/2,516 = 0.26 kWh/t
- ball mill power draw (at motor input, per mill) = 13,982 kW (at mill shell = 13,221 kW)
- ball mill % solids = 80% weight
- ball mill total charge = 25.4
- ball mill speed = 79.61% of critical
- Ebm at mill shell = (2×13,221)/2,516 = 10.5 kWh/t
Design Criteria
- Ore A×b = 26.6, between 25th and 50th percentiles
- WiBM use 50th percentile = 14.3 kWh/tonne.
- WiRM use 50th percentile = 18.0 kWh/tonne.
- WiC use 50th percentile = 14.8 kWh/tonne.
- Plant availability = 87%
Mill criteria
- SAG mills: two 36 foot nom diam by 17.25 foot effective grinding length (EGL)
- ball mill: two 25 foot nom diam by 38.0 foot EGL (flange-to-flange length 38.5)
- SAG mills, each twin variable speed motor 7000 kW (each mill)
- Ball mill, each twin (assumed variable speed) motors 7500 kW (each mill)
Modelling
SAG mill is modelled using following:
- Austin SAG model
- ore density 2.9 t/m³
- SAG liners nominal 4 inch liner thickness
- liner thickness based on JK Simulation in Table 3
- effective dimensions 10768 mm diam × 5334 mm EGL
- predicted SAG power draw at mill shell = 13,448 kW (5.9% higher than actual)
Ball mill is modelled using following:
- Nordberg ball mill wet overflow with density correction
- ore density 2.9 t/m³
- ball mill nominal 90 mm liner thickness
- liner thickness based on JK Simulation in Table 3
- effective dimensions 7439 mm diam × 11581 mm EGL
- predicted ball mill power at mill shell = 13,273 kW (0.4% higher than actual)
Results
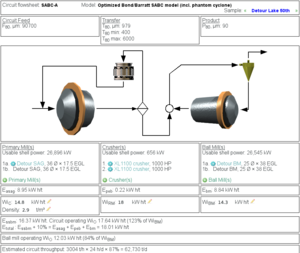
Result for default Optimized Bond/Barratt model conditions:
| Esag | Epeb | Ebm | Etotal | t/h | |
|---|---|---|---|---|---|
| Predicted | 9.0 | 0.2 | 8.8 | 18.0 | 3004 |
| 2015 data | 10.1 | 0.3 | 10.5 | 20.9 | 2516 |
| Difference | 1.1 | 0.1 | 1.7 | 2.9 | 508 |
| Difference | model 12% low | model 33% low | model 16% low | model 14% low | model 20% high |
Discussion
The mill is in the final stages of ramp-up, and has not reached its ultimate capacity. Figure 5 shows they are consistently exceeding 2,700 t/h in April & May of 2015, suggesting they can do 7% more than the data in Table 7.
If we claim that 7% difference between April/May and the 2015 data, then the differences become:
- Etotal : actual = 19.5 kWh/t, model 7% low
- t/h : actual = 2700 t/h, model 13% high
The ultimate capacity of this circuit hasn't been established yet, so it could very likely continue to improve and approach the model numbers.
Trying the Raw Bond/Barratt model and comparing to the April/May 2015 values, the model predicts:
- Etotal : 18.3 kWh/t, model 1% high
- t/h : 2992 t/h, model 2% high
