Difference between revisions of "Benchmarking: Bond - Cadia"
(Created page with "category:benchmarking category:Bond/Barratt model ==Benchmarking: Bond/Barratt - Cadia== ''Dunne, R., Morrell, S., Lane, G., Valery, W. and Hart, S.'', '''Design of th...") |
(→Results) |
||
| (3 intermediate revisions by the same user not shown) | |||
| Line 1: | Line 1: | ||
[[category:benchmarking]] |
[[category:benchmarking]] |
||
| − | [[category:Bond/Barratt |
+ | [[category:Bond/Barratt Model]] |
==Benchmarking: Bond/Barratt - Cadia== |
==Benchmarking: Bond/Barratt - Cadia== |
||
''Dunne, R., Morrell, S., Lane, G., Valery, W. and Hart, S.'', '''Design of the 40 foot diameter SAG mill installed at the Cadia gold copper mine'''. Proceedings of SAG 2001, pages I-43 to I-58. |
''Dunne, R., Morrell, S., Lane, G., Valery, W. and Hart, S.'', '''Design of the 40 foot diameter SAG mill installed at the Cadia gold copper mine'''. Proceedings of SAG 2001, pages I-43 to I-58. |
||
| + | |||
''Lane, G., Foggiatto, B. and Bueno, M'', '''Power-based comminution calculations using Ausgrind'''. Proceedings of Procemin 2013, Chapter 2, paper 2. |
''Lane, G., Foggiatto, B. and Bueno, M'', '''Power-based comminution calculations using Ausgrind'''. Proceedings of Procemin 2013, Chapter 2, paper 2. |
||
| − | + | Papers describe a survey conducted shortly after start-up. |
|
| − | Ore characterization |
+ | ===Ore characterization=== |
* Monzonite ore type, |
* Monzonite ore type, |
||
** Wi<sub>C</sub> = 16.5 (metric) |
** Wi<sub>C</sub> = 16.5 (metric) |
||
| Line 15: | Line 16: | ||
** DWI = 7.5 |
** DWI = 7.5 |
||
** density = 2.7 t/m³ |
** density = 2.7 t/m³ |
||
| − | * SAG feed is primary crushed to F<sub>80</sub> = 98 mm |
||
| − | * Ball mill circuit product P<sub>80</sub> = 170 µm |
||
| − | SAG mill characteristics |
+ | ===SAG mill characteristics=== |
* Diameter inside shell = 12.2 m (40 ft) |
* Diameter inside shell = 12.2 m (40 ft) |
||
* EGL = 6.1 m (20 ft) |
* EGL = 6.1 m (20 ft) |
||
| Line 25: | Line 24: | ||
* Mill speed = 78% of critical <small>(Lane et al, 2013 appears to have a typo. They claim 72% which actually looks like the BM speed)</small> |
* Mill speed = 78% of critical <small>(Lane et al, 2013 appears to have a typo. They claim 72% which actually looks like the BM speed)</small> |
||
* Pulp density = 70% w/w |
* Pulp density = 70% w/w |
||
| + | * SAG feed is primary crushed to F<sub>80</sub> = 98 mm |
||
| − | Ball mill characteristics |
+ | ===Ball mill characteristics=== |
* Diameter inside shell = 6.7 m (22 ft) |
* Diameter inside shell = 6.7 m (22 ft) |
||
* EGL = 11.3 m (36.5 ft) |
* EGL = 11.3 m (36.5 ft) |
||
| Line 32: | Line 32: | ||
* Mill speed = 72% of critical |
* Mill speed = 72% of critical |
||
* Pulp density = 70% w/w |
* Pulp density = 70% w/w |
||
| + | * Ball mill circuit product P<sub>80</sub> = 170 µm |
||
| + | ===Modelling=== |
||
| − | Result for default model conditions: |
||
| + | <gallery> |
||
| + | File:Procemin-CadiaBenchmarking.png|Model screenshot of Cadia 1998 survey simulation |
||
| + | File:Procemin2013-CadiaSag.png|SAG model screenshot of Cadia 1998 survey simulation |
||
| + | File:Procemin2013-CadiaBM.png|Ball mill model screenshot of Cadia 1998 survey simulation |
||
| + | </gallery> |
||
| + | |||
| + | ===Results=== |
||
| + | |||
| + | Result for default Optimized Bond/Barratt SABC-A model conditions: |
||
{| class="wikitable" border="1" |
{| class="wikitable" border="1" |
||
|- |
|- |
||
! |
! |
||
| + | !T80, mm |
||
!Esag |
!Esag |
||
!Epeb |
!Epeb |
||
| Line 42: | Line 53: | ||
!Etotal |
!Etotal |
||
!t/h |
!t/h |
||
| − | !T80, mm |
||
|- |
|- |
||
| Predicted |
| Predicted |
||
| + | | 2.06 |
||
| 8.6 |
| 8.6 |
||
| 0.3 |
| 0.3 |
||
| Line 50: | Line 61: | ||
| 17.4 |
| 17.4 |
||
| 2000 |
| 2000 |
||
| − | | 2.06 |
||
|- |
|- |
||
| Survey |
| Survey |
||
| + | | 1.34 |
||
| 8.6 |
| 8.6 |
||
| - |
| - |
||
| Line 58: | Line 69: | ||
| 16.6 |
| 16.6 |
||
| 2065 |
| 2065 |
||
| − | | 1.34 |
||
|- |
|- |
||
| Difference |
| Difference |
||
| + | | 0.72 |
||
| 0 |
| 0 |
||
| 0.3 |
| 0.3 |
||
| Line 66: | Line 77: | ||
| 0.8 |
| 0.8 |
||
| -65 |
| -65 |
||
| − | | 0.72 |
||
|- |
|- |
||
| Difference |
| Difference |
||
| + | | 54% |
||
| 0% |
| 0% |
||
| - |
| - |
||
| Line 74: | Line 85: | ||
| 5% |
| 5% |
||
| -3% |
| -3% |
||
| − | | 54% |
||
|} |
|} |
||
| + | |||
| + | |||
| + | ===Discussion=== |
||
| + | * The rod mill work index was determined on an apparatus with a smooth liner. Bond specified that the liners of a Bond rod mill work index apparatus should have wave liners, and the Optimized Bond/Barratt model is calibrated to the wave-liner machines. If one deducts 2 kWh/t from the rod mill work index (allowance for difference in apparatus) and re-runs the calculation, the following results are obtained: |
||
| + | ** E<sub>SAG</sub> = 8.3 kWh/t (-3% from survey) |
||
| + | ** E<sub>ball</sub> = 8.2 kWh/t (+2% from survey) |
||
| + | ** E<sub>total</sub> = 16.8 kWh/t (+1% from survey) |
||
| + | * Using the Raw Bond/Barratt model predicts E<sub>total</sub> = 18.2 kWh/t (+10% from survey). The Optimized Bond/Barratt model works better at modelling this circuit. |
||
Latest revision as of 22:49, 31 January 2015
Contents
Benchmarking: Bond/Barratt - Cadia
Dunne, R., Morrell, S., Lane, G., Valery, W. and Hart, S., Design of the 40 foot diameter SAG mill installed at the Cadia gold copper mine. Proceedings of SAG 2001, pages I-43 to I-58.
Lane, G., Foggiatto, B. and Bueno, M, Power-based comminution calculations using Ausgrind. Proceedings of Procemin 2013, Chapter 2, paper 2.
Papers describe a survey conducted shortly after start-up.
Ore characterization
- Monzonite ore type,
- WiC = 16.5 (metric)
- WiRM = 19.0 (metric)
- WiBM = 17.1 (metric)
- A×b = 36
- DWI = 7.5
- density = 2.7 t/m³
SAG mill characteristics
- Diameter inside shell = 12.2 m (40 ft)
- EGL = 6.1 m (20 ft)
- Ball filling = 12% v/v
- Total filling = 25% v/v
- Mill speed = 78% of critical (Lane et al, 2013 appears to have a typo. They claim 72% which actually looks like the BM speed)
- Pulp density = 70% w/w
- SAG feed is primary crushed to F80 = 98 mm
Ball mill characteristics
- Diameter inside shell = 6.7 m (22 ft)
- EGL = 11.3 m (36.5 ft)
- Ball filling = 30% v/v
- Mill speed = 72% of critical
- Pulp density = 70% w/w
- Ball mill circuit product P80 = 170 µm
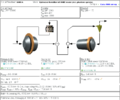
Modelling
Results
Result for default Optimized Bond/Barratt SABC-A model conditions:
| T80, mm | Esag | Epeb | Ebm | Etotal | t/h | |
|---|---|---|---|---|---|---|
| Predicted | 2.06 | 8.6 | 0.3 | 8.5 | 17.4 | 2000 |
| Survey | 1.34 | 8.6 | - | 8 | 16.6 | 2065 |
| Difference | 0.72 | 0 | 0.3 | 0.5 | 0.8 | -65 |
| Difference | 54% | 0% | - | 6% | 5% | -3% |
Discussion
- The rod mill work index was determined on an apparatus with a smooth liner. Bond specified that the liners of a Bond rod mill work index apparatus should have wave liners, and the Optimized Bond/Barratt model is calibrated to the wave-liner machines. If one deducts 2 kWh/t from the rod mill work index (allowance for difference in apparatus) and re-runs the calculation, the following results are obtained:
- ESAG = 8.3 kWh/t (-3% from survey)
- Eball = 8.2 kWh/t (+2% from survey)
- Etotal = 16.8 kWh/t (+1% from survey)
- Using the Raw Bond/Barratt model predicts Etotal = 18.2 kWh/t (+10% from survey). The Optimized Bond/Barratt model works better at modelling this circuit.


