Difference between revisions of "Benchmarking: Bond - Esperanza"
| (One intermediate revision by the same user not shown) | |||
| Line 11: | Line 11: | ||
* A×b of Esperanza ore (Aug-Dec 2012); avg= 39; range is 30.7 to 45.5. |
* A×b of Esperanza ore (Aug-Dec 2012); avg= 39; range is 30.7 to 45.5. |
||
* Wi<sub>BM</sub> average is 16.0 kWh/st, = 17.6 kWh/tonne. |
* Wi<sub>BM</sub> average is 16.0 kWh/st, = 17.6 kWh/tonne. |
||
| − | * E<sub>SAG</sub> for "normal" blasting, average = 5. |
+ | * E<sub>SAG</sub> for "normal" blasting, average = 5.5 kWh/tonne; range is 3.9 to 7.2 kWh/tonne. |
* E<sub>SAG</sub> for "high intensity" blasting typically 10% lower E<sub>SAG</sub>. |
* E<sub>SAG</sub> for "high intensity" blasting typically 10% lower E<sub>SAG</sub>. |
||
* SAG feed size range 33.6% to 49.0 percent passing 1¼ inch (32 mm). |
* SAG feed size range 33.6% to 49.0 percent passing 1¼ inch (32 mm). |
||
| − | |||
| − | A relationship for E<sub>SAG</sub> (as kWh/tonne) to A×b is given for Esperanza operating data: |
||
| − | |||
| − | <math>E_{SAG} = 22,548 (A \times b)^{-0.356} </math> |
||
| − | |||
| − | No E<sub>BM</sub> or E<sub>total</sub> data is provided in the paper. |
||
Design criteria for expansion cases (which may reflect Esperanza operating conditions) |
Design criteria for expansion cases (which may reflect Esperanza operating conditions) |
||
| Line 65: | Line 59: | ||
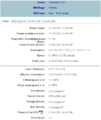
File:Screengrab_EsperanzaSAG.png|Model configuration for benchmarking |
File:Screengrab_EsperanzaSAG.png|Model configuration for benchmarking |
||
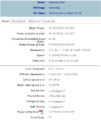
File:Screengrab_EsperanzaBM.png|Model configuration for benchmarking |
File:Screengrab_EsperanzaBM.png|Model configuration for benchmarking |
||
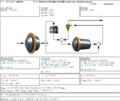
| − | File: |
+ | File:Screengrab_EsperanzaAvgOre.png|Esperanza benchmarking circuit model screen grab |
</gallery> |
</gallery> |
||
| Line 73: | Line 67: | ||
{|class="wikitable" border="1" |
{|class="wikitable" border="1" |
||
| − | ! !!Average ore |
+ | ! !! Average ore |
|- |
|- |
||
| − | | Measured SAG specific energy consumption, kWh/t |
+ | | Measured SAG specific energy consumption, kWh/t |
| + | | style="text-align:center"| 5.5 |
||
|- |
|- |
||
| − | | Predicted SAG specific energy consumption, kWh/t |
+ | | Predicted SAG specific energy consumption, kWh/t |
| + | | style='text-align:center' | 5.9 |
||
|- |
|- |
||
| − | | Difference, kWh/t |
+ | | Difference, kWh/t |
| + | | style='text-align:center'| 0.4 |
||
|- |
|- |
||
| − | | Difference, % |
+ | | Difference, % |
| + | | style='text-align:center'| model predicts 7% high |
||
|} |
|} |
||
Latest revision as of 00:42, 10 January 2015
Contents
Benchmarking: Bond/Barratt SAG Mill Specific Energy Consumption - Esperanza
- Villanueva, F. and Soto, L., SEC and the impact on a mills selection for DMC project. Proceedings of the XXVII International Mineral Processing Congress, October 2014, Santiago, Chile. C14-23.
Paper describes modelling of two expansion cases (Esperanza Sur and Encuentro). Some operating data for the current Esperanza pit & plant are provided as they were used to tune the comminution models used for the expansion cases.
Design Criteria
Actual operating data from Esperanza
- A×b of Esperanza ore (Aug-Dec 2012); avg= 39; range is 30.7 to 45.5.
- WiBM average is 16.0 kWh/st, = 17.6 kWh/tonne.
- ESAG for "normal" blasting, average = 5.5 kWh/tonne; range is 3.9 to 7.2 kWh/tonne.
- ESAG for "high intensity" blasting typically 10% lower ESAG.
- SAG feed size range 33.6% to 49.0 percent passing 1¼ inch (32 mm).
Design criteria for expansion cases (which may reflect Esperanza operating conditions)
- SAG circuit F80 = 132 mm
- transfer T80 = 3500 µm (text erroneously says "3500 mm")
- BM circuit P80 = 180 µm
- SAG mill power utilization = 92.3%
- Ball mill power utilization = 95%
- Plant availability = 93%
Mill criteria
- SAG mill: 40 foot nom dia by 26 foot flange-to-flange cylinder length
- ball mill: 27 foot nom dia by 45 foot flange-to-flange cylinder length (2 units)
- SAG mill gearless motor 31,500 HP (given in Thiele & Parraguez, Relpas 2011 conference)
- Ball mill gearless motors 25,000 HP
(some references give 30,000 HP for SAG motor; this is thought to be the value excluding a 5% design margin)
Modelling
The Bond/Barratt SABC-B model is used with the default 10% Essbm calibration factor.
- circuit F80 = 132 mm
- circuit P80 = 180 µm
- The average ball mill work index given as 16 kWh/short ton = 17.6 kWh/tonne
- The relationship between A×b and WiRM for Andean copper porphyries can be used to determine the following rod mill work index values.
- A×b of Esperanza ore; avg= 39; becomes WiRM=14.5 kWh/tonne
- No crushing work index is given. Assume a value of 12 kWh/tonne (slightly higher than typical porphyry)
- No ore density is given. Assume similar to Los Bronces, density=2.64 t/m³
SAG mill is modelled using following:
- Austin model
- assume ore density 2.64 t/m³, same as Los Bronces
- nominal diameter 40 foot, effective grinding length 26 foot (deduct 2 ft from cylinder length)
- assume 6 inch liner effective thickness, mill speed 75% of critical
- ball charge 16% v/v; total filling 26% v/v gives the desired 92.4% utilization of motor power
Ball mill is modelled using following:
- Nordberg wet overflow model
- assume ore density 2.64 t/m³, same as Los Bronces
- nominal diameter 27 foot, effective grinding length 44.5 foot (deduct 6 inches from cylinder length)
- assume 6 inch liner effective thickness, mill speed 75% of critical
- total filling 30% v/v gives the desired 95% utilization of motor power
Results
Only one ball mill work index is provided, claimed to be the 'average'. The predictions of the min/max range are dubious because the ball mill work index should change between hard and soft ore.
| Average ore | |
|---|---|
| Measured SAG specific energy consumption, kWh/t | 5.5 |
| Predicted SAG specific energy consumption, kWh/t | 5.9 |
| Difference, kWh/t | 0.4 |
| Difference, % | model predicts 7% high |


