Difference between revisions of "Benchmarking: Bond - Meadowbank"
(→Benchmarking: Bond/Barratt Circuit Specific Energy Consumption - Meadowbank) |
(→Sick circuit simulation) |
||
| (4 intermediate revisions by 2 users not shown) | |||
| Line 24: | Line 24: | ||
* Wi<sub>C</sub> 17.6 kWh/t |
* Wi<sub>C</sub> 17.6 kWh/t |
||
| − | The "sick" mill corresponds to the May 2012 survey and the "healthy" mill corresponds to the September 2012 conditions in Figures 7 and 8. |
+ | The "sick" mill corresponds to the May 2012 survey and the "healthy" mill corresponds to the September 2012 conditions in Figures 7 and 8. |
| + | |||
| + | The SAG mill uses a standard Austin model and the ball mill uses a Nordberg wet overflow model without density correction. |
||
==Model parameter fitting, sick & healthy circuits== |
==Model parameter fitting, sick & healthy circuits== |
||
| Line 71: | Line 73: | ||
* Actual SAG/ball motor powers (at shell): 3,168 kW / 4,105 kW |
* Actual SAG/ball motor powers (at shell): 3,168 kW / 4,105 kW |
||
* Actual daily average throughput: 500 tonnes/hour |
* Actual daily average throughput: 500 tonnes/hour |
||
| − | * Predicted SAG/ball motor powers (at shell): 3, |
+ | * Predicted SAG/ball motor powers (at shell): 3,085 kW / 4,186 kW |
* Predicted nominal throughput: 500 tonnes/hour (no difference) |
* Predicted nominal throughput: 500 tonnes/hour (no difference) |
||
| Line 79: | Line 81: | ||
| Measured specific energy consumption, kWh/t||6.34||8.21||14.55 |
| Measured specific energy consumption, kWh/t||6.34||8.21||14.55 |
||
|- |
|- |
||
| − | | Predicted specific energy consumption, kWh/t||6. |
+ | | Predicted specific energy consumption, kWh/t||6.18||8.38||14.55 |
|- |
|- |
||
| − | | Difference, kWh/t||-0. |
+ | | Difference, kWh/t||-0.16||0.17||0.00 |
|- |
|- |
||
| − | | Difference, %||-2. |
+ | | Difference, %||-2.5%||2.1%||0.0% |
|} |
|} |
||
| Line 90: | Line 92: | ||
==Sick circuit simulation== |
==Sick circuit simulation== |
||
[[File:Benchmarking-Meadowbank-Sick.png|thumb|Screenshot of the "sick" Meadowbank circuit simulation]] |
[[File:Benchmarking-Meadowbank-Sick.png|thumb|Screenshot of the "sick" Meadowbank circuit simulation]] |
||
| − | Modelling the "sick" SAG mill is more difficult. The transfer size is forced to match the survey value by setting the upper limit to the surveyed value 1240 µm (and neglecting a phantom cyclone effect as it can not be calculated without a full size distribution). This forces the circuit into a SAG-limited situation which will restrict the throughput. The ball mill is modelled with a |
+ | Modelling the "sick" SAG mill is more difficult. The transfer size is forced to match the survey value by setting the upper limit to the surveyed value 1240 µm (and neglecting a phantom cyclone effect as it can not be calculated without a full size distribution). This forces the circuit into a SAG-limited situation which will restrict the throughput. The ball mill is modelled with a fixed speed (overgrinding versus the target P<sub>80</sub>), but is not important to the overall throughput. In reality, the ball mill is probably operating inefficiently under these conditions and the product will be coarser than predicted. |
* Actual SAG/ball motor powers (at shell): 3,374 kW / 4,341 kW |
* Actual SAG/ball motor powers (at shell): 3,374 kW / 4,341 kW |
||
* Actual daily average throughput: 446 tonnes/hour |
* Actual daily average throughput: 446 tonnes/hour |
||
| − | * Predicted SAG/ball motor powers (at shell): 3, |
+ | * Predicted SAG/ball motor powers (at shell): 3,085 kW / 4,186 kW |
| − | * Predicted nominal throughput: |
+ | * Predicted nominal throughput: 405 tonnes/hour (-9.2% difference) |
{|class="wikitable" border="1" |
{|class="wikitable" border="1" |
||
| Line 102: | Line 104: | ||
| Measured specific energy consumption, kWh/t||7.15||9.20||16.36 |
| Measured specific energy consumption, kWh/t||7.15||9.20||16.36 |
||
|- |
|- |
||
| − | | Predicted specific energy consumption, kWh/t||7. |
+ | | Predicted specific energy consumption, kWh/t||7.62||10.33||17.95 |
|- |
|- |
||
| − | | Difference, kWh/t||+0. |
+ | | Difference, kWh/t||+0.47||+1.13||+1.59 |
|- |
|- |
||
| − | | Difference, %||+ |
+ | | Difference, %||+6.6%||+12.3%||+9.7% |
|} |
|} |
||
Latest revision as of 18:32, 22 May 2020
Contents
Benchmarking: Bond/Barratt Circuit Specific Energy Consumption - Meadowbank
- Muteb, P. & Allaire, J., Meadowbank Mine Process Plant Throughput Increase, Proceedings of the Canadian Mineral Processors Annual General Meeting, Ottawa, Canada, January 2013.
Paper describes a "sick" SAG mill and the changes made to "bring it to health".
Design criteria
A survey was conducted on the "sick" mill in May, 2012 reported the following the following:
- A×b 38.6
- Ball mill work index 10.9 kWh/t
- Ore density 2.93 kg/L (contains magnetite)
- SAG mill feed F80 38 mm (pre-crushing)
- Cyclone overflow P80 79 µm
- Throughput 446 tonnes/hour
To run the Bond/Barratt model requires work index values for rod milling and crushing. The reported A×b (38.6) is similar to the "Design Criteria" sample at Phoenix (A×b of 37.5) published by J.Seidel et al, SAG 2006. Seidel also reported the following work index values that will be used as proxies for the Meadowbank ore:
- WiRM 17.2 kWh/t
- WiC 17.6 kWh/t
The "sick" mill corresponds to the May 2012 survey and the "healthy" mill corresponds to the September 2012 conditions in Figures 7 and 8.
The SAG mill uses a standard Austin model and the ball mill uses a Nordberg wet overflow model without density correction.
Model parameter fitting, sick & healthy circuits
The following tables back-calculate the "Essbm contingency" model fitting parameter for the Bond/Barratt SABC model (which includes allowance for phantom cyclone effects). Specific energy references the "mill shell" kW values.
| "Sick" SAG | SAG | BM | Etotal |
|---|---|---|---|
| DCS kW | 3,374 | 4,341 | |
| Shell kW | 3,190 | 4,105 | |
| Throughput, t/h | 446 | 446 | |
| Specific Energy, kWh/t | 7.15 | 9.20 | 16.36 |
| Essbm | 13.23 | ||
| contingency | 24% |
Note that no survey was done in this period, so the Essbm is assumed to be the same as the May 2012 value (the ore is the same hardness).
| "Healthy" SAG | SAG | BM | Etotal |
|---|---|---|---|
| DCS kW | 3,350 | 4,341 | |
| Shell kW | 3,168 | 4,105 | |
| Throughput, t/h | 500 | 500 | Etotal |
| Specific Energy, kWh/t | 6.34 | 8.21 | 14.55 |
| Essbm | 13.23 | ||
| contingency | 10% |
The default contingency for a Bond/Barratt SABC model is 10%. The "healthy" mill work out to exactly 10% - the model Etotal value fits perfectly.
Healthy circuit simulation
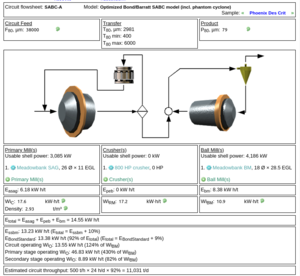
Combining the Bond/Barratt specific energy model, the Austin SAG model described in the bibliography and the Nordberg ball mill model described in the bibliography results in the following throughput predictions for a "healthy" milling circuit using the work index values above:
- Actual SAG/ball motor powers (at shell): 3,168 kW / 4,105 kW
- Actual daily average throughput: 500 tonnes/hour
- Predicted SAG/ball motor powers (at shell): 3,085 kW / 4,186 kW
- Predicted nominal throughput: 500 tonnes/hour (no difference)
| SAG | BM | total | |
|---|---|---|---|
| Measured specific energy consumption, kWh/t | 6.34 | 8.21 | 14.55 |
| Predicted specific energy consumption, kWh/t | 6.18 | 8.38 | 14.55 |
| Difference, kWh/t | -0.16 | 0.17 | 0.00 |
| Difference, % | -2.5% | 2.1% | 0.0% |
The total specific energy consumption is exactly the same in the simulation as is observed in the plant, and the estimates for ESAG and Eball are very close to the plant observation. The model throughput prediction exactly matches the plant measurement.
Sick circuit simulation
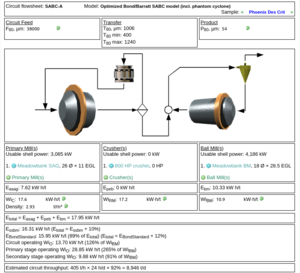
Modelling the "sick" SAG mill is more difficult. The transfer size is forced to match the survey value by setting the upper limit to the surveyed value 1240 µm (and neglecting a phantom cyclone effect as it can not be calculated without a full size distribution). This forces the circuit into a SAG-limited situation which will restrict the throughput. The ball mill is modelled with a fixed speed (overgrinding versus the target P80), but is not important to the overall throughput. In reality, the ball mill is probably operating inefficiently under these conditions and the product will be coarser than predicted.
- Actual SAG/ball motor powers (at shell): 3,374 kW / 4,341 kW
- Actual daily average throughput: 446 tonnes/hour
- Predicted SAG/ball motor powers (at shell): 3,085 kW / 4,186 kW
- Predicted nominal throughput: 405 tonnes/hour (-9.2% difference)
| SAG | BM | total | |
|---|---|---|---|
| Measured specific energy consumption, kWh/t | 7.15 | 9.20 | 16.36 |
| Predicted specific energy consumption, kWh/t | 7.62 | 10.33 | 17.95 |
| Difference, kWh/t | +0.47 | +1.13 | +1.59 |
| Difference, % | +6.6% | +12.3% | +9.7% |

