Conversions between test types

From SAGMILLING.COM
Revision as of 13:39, 1 March 2023 by Alex Doll (talk | contribs) (Extra parameters for Drop Weight Tests (DWT))
Jump to: navigation, search

Converting between comminution test types

Different tests are used in different grindability models for substantially the same purposes. Certain grindability tests are compatible with other tests, and an approximate conversion can be established by comparing to a database of testwork.

The determination of which tests are compatible with other tests is largely a function of the particle size of the specimens subjected to testing.Doll & Barratt, 2011 Ore properties also play a role because some tests are sensitive to changes in ore density and other tests operate with a biased sample consisting only of competent pieces.

Medium size class

The three tests in the medium size class are:

  • Bond rod mill work index (WiRM)
  • SAG Grindability index (SGI) or SAG Power index (SPI™)
  • Drop weight test, both JK and SMC (A×b, DWI, Mia, etc)
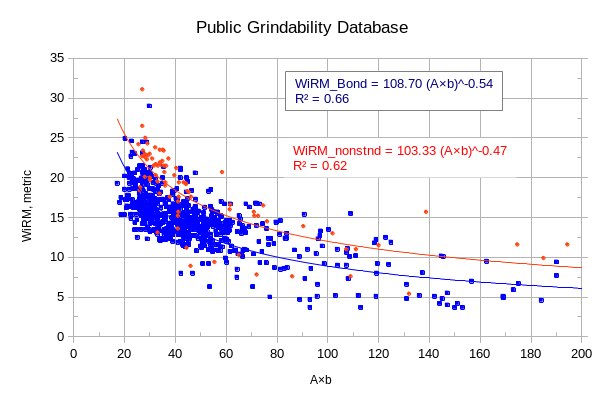
Bond rod mill work index versus A×b
Only considering rod mill work index tests performed in laboratory mills equipped with wave liners. This is the standard specified by F. Bond and is typical of laboratories in North and South America.

Non-standard (Australian type) rod mill results also shown for comparison.

A Non-standard rod mill result can be converted to a Bond rod mill work index by:

Bond WiRM = 0.49 × (Winonstandard)^1.17

Source: Dec 2021 Public Grindability Database

ExampleDB-WiRMvAxb-comparison.png
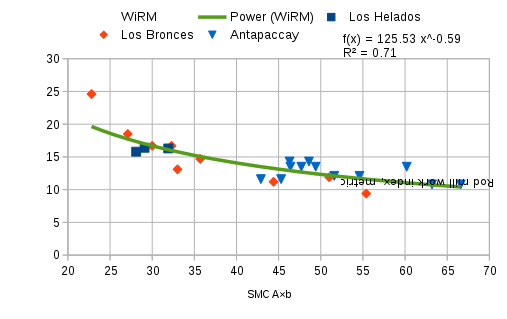
Bond rod mill Wi versus A×b for copper porphyries
A slightly better relationship can be determined if the database is limited to projects of a similar lithology. Limiting to only the Andean copper porphyry projects results in a slightly better correlation.
Published A×b and WiRM results for Andean porphyries
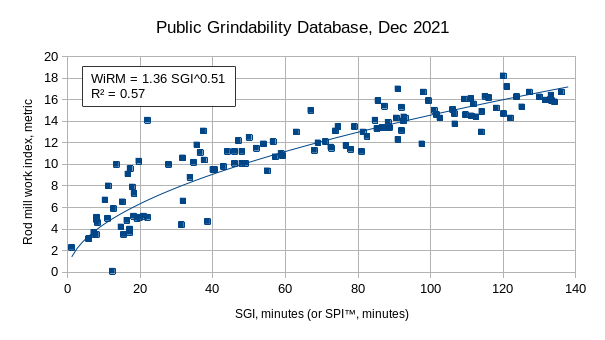
Bond rod mill work index versus SGI & SPI
Only considering rod mill work index tests performed in laboratory mills equipped with wave liners. SGI does not contain a density correction, and this relationship is probably only valid for ore density in the range of 2.50 to 2.80 t/m3

Only considers SGI values less than 160 as greater values are meaningless.
ExampleDB-WiRMvSGI-comparison.png
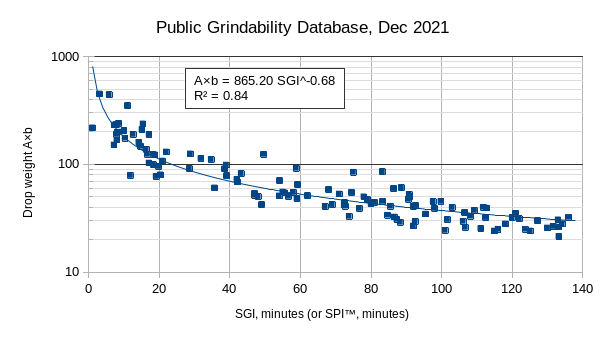
SGI & SPI versus A×b
Only considering SGI values below 160 minutes. SGI does not contain a density correction, and this relationship is probably only valid for ore density in the range of 2.50 to 2.80 t/m3
SGI vs A×b.png

Extra parameters for Drop Weight Tests (DWT)

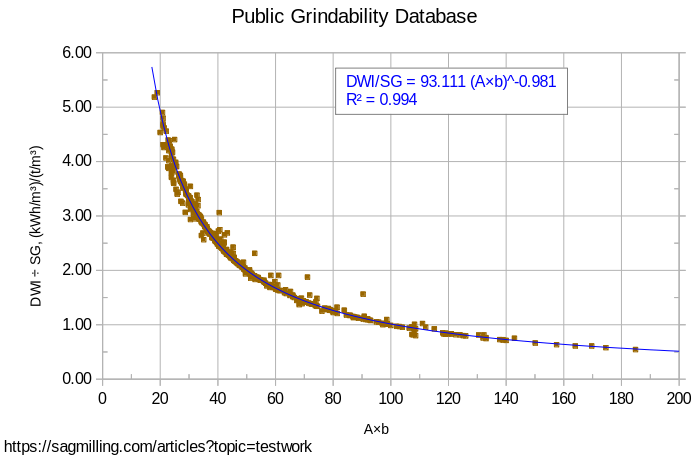
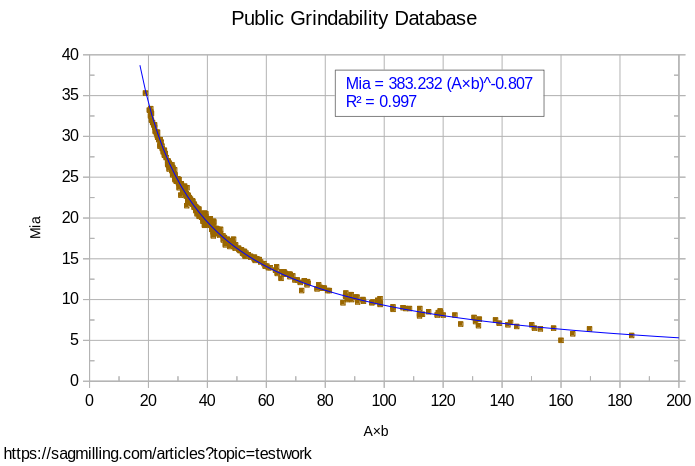
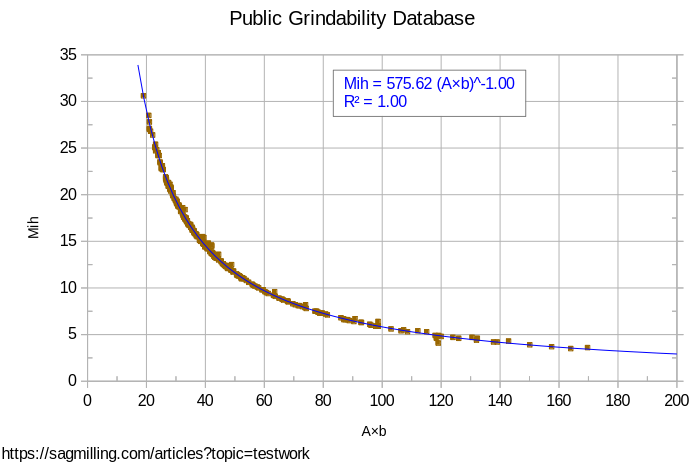
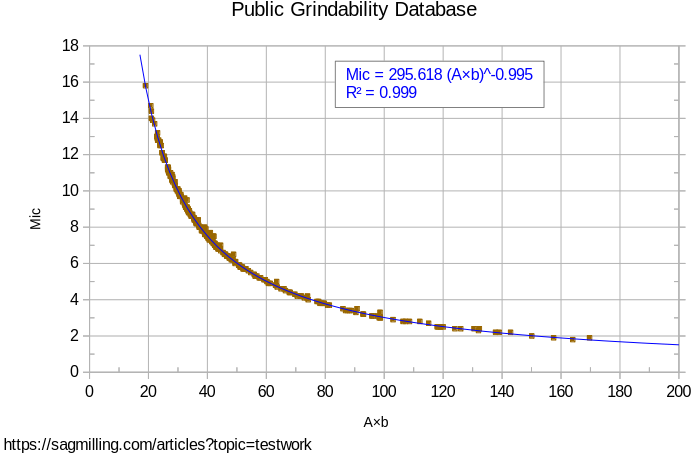
A drop weight test is usually interpreted using a plot of the %passing 10% of the original particle size (t10) versus the energy of the weight that impacted the specimen (Ecs). These are plotted at fit to an exponential relationship with fitting parameters "A" (coefficient) and "b" (exponent).

There are several derived parameters that are commonly used in modelling that can be calculated using these A and b values, usually based on the slope of the curve at the origin of the plot. This is commonly referred to as the (A×b) value.

  • DWI = (density, kg/L) × 93.11 × (A×b)-0.981
  • Mia = 383.23 × (A×b)-0.807
  • Mih = 575.6 × (A×b)-1.000
  • Mic = 295.6 × (A×b)-0.995

DWI Axb.png

Mia Axb.png

Mih Axb.png

Mic Axb.png