Difference between revisions of "How to copy data"
(→How to copy data out of a table) |
(→Simulation result table) |
||
| (One intermediate revision by the same user not shown) | |||
| Line 1: | Line 1: | ||
[[category:Howto]] |
[[category:Howto]] |
||
==How to copy data out of a table== |
==How to copy data out of a table== |
||
| − | Most users of SAGMILLING.COM use spreadsheet software for performing additional calculations, comparisons and to format output. Most of the tables of data generated by SAGMILLING.COM contain a special <i>text box</i> where the table contents can easily be copied and pasted into your favourite spreadsheet software ( |
+ | Most users of SAGMILLING.COM use spreadsheet software for performing additional calculations, comparisons and to format output. Most of the tables of data generated by SAGMILLING.COM contain a special <i>text box</i> where the table contents can easily be copied and pasted into your favourite spreadsheet software (LibreOffice, Google Shets, Microsoft Excel, etc.) |
Tables of data include icons that permit data to be exported in a variety of ways. Not every table has all these options available, and the exact output will vary depending on which table is being exported. |
Tables of data include icons that permit data to be exported in a variety of ways. Not every table has all these options available, and the exact output will vary depending on which table is being exported. |
||
| Line 7: | Line 7: | ||
* '''PDF''' icon begins a download of a detailed report including, where appropriate, tables and graphs of data. |
* '''PDF''' icon begins a download of a detailed report including, where appropriate, tables and graphs of data. |
||
* '''Raw cut & paste''' icon opens a box with a large text field containing all the data in the table, formatted in a special form that is easy for spreadsheets to import. Do not worry that the formatted data looks strange to humans -- just select the whole data field (usually clicking the mouse in the field and pressing Ctrl-A on the keyboard) and copy it (usually by selecting Edit|Copy from your browser's menu bar). Then switch to your spreadsheet and paste (usually by selecting Edit|Paste from your spreadsheet's menu bar). |
* '''Raw cut & paste''' icon opens a box with a large text field containing all the data in the table, formatted in a special form that is easy for spreadsheets to import. Do not worry that the formatted data looks strange to humans -- just select the whole data field (usually clicking the mouse in the field and pressing Ctrl-A on the keyboard) and copy it (usually by selecting Edit|Copy from your browser's menu bar). Then switch to your spreadsheet and paste (usually by selecting Edit|Paste from your spreadsheet's menu bar). |
||
| + | |||
| + | ===Simulation result table=== |
||
| + | [[File:ExportOptions.png|thumb]] |
||
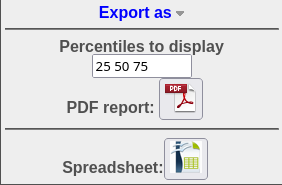
| + | Two options are to generate a PDF report or export as a spreadsheet. |
||
| + | |||
| + | The PDF report will include the following information for the specified percentiles: |
||
| + | * simulation detail page including the flowsheet, model inputs, and model outputs. |
||
| + | * details of the mills and motors. |
||
| + | *tent diagrams for the mill motors. |
||
| + | |||
| + | Note that the sorting of the output PDF (and how the percentiles are displayed) are based on the current sorting of the table you are viewing. If the table is sorted alphabetically by sample name, then the percentiles relate to that alphabetic sorting; if the table is sorted by t/h, then the percentiles relate to throughput. |
||
Latest revision as of 15:26, 2 November 2023
How to copy data out of a table
Most users of SAGMILLING.COM use spreadsheet software for performing additional calculations, comparisons and to format output. Most of the tables of data generated by SAGMILLING.COM contain a special text box where the table contents can easily be copied and pasted into your favourite spreadsheet software (LibreOffice, Google Shets, Microsoft Excel, etc.)
Tables of data include icons that permit data to be exported in a variety of ways. Not every table has all these options available, and the exact output will vary depending on which table is being exported.
- ODS icon begins a download of an OpenOffice or LibreOffice spreadsheet. This can be used directly in versions of Microsoft Excel versions 2011 and newer.
- PDF icon begins a download of a detailed report including, where appropriate, tables and graphs of data.
- Raw cut & paste icon opens a box with a large text field containing all the data in the table, formatted in a special form that is easy for spreadsheets to import. Do not worry that the formatted data looks strange to humans -- just select the whole data field (usually clicking the mouse in the field and pressing Ctrl-A on the keyboard) and copy it (usually by selecting Edit|Copy from your browser's menu bar). Then switch to your spreadsheet and paste (usually by selecting Edit|Paste from your spreadsheet's menu bar).
Simulation result table
Two options are to generate a PDF report or export as a spreadsheet.
The PDF report will include the following information for the specified percentiles:
- simulation detail page including the flowsheet, model inputs, and model outputs.
- details of the mills and motors.
- tent diagrams for the mill motors.
Note that the sorting of the output PDF (and how the percentiles are displayed) are based on the current sorting of the table you are viewing. If the table is sorted alphabetically by sample name, then the percentiles relate to that alphabetic sorting; if the table is sorted by t/h, then the percentiles relate to throughput.
