Benchmarking: Bond - Kanowna Belle
Contents
Benchmarking: Bond/Barratt SABC Circuit Specific Energy Consumption - Kanowna Belle
Lunt, D.J., Thompson, A. and Ritchie, I. The Design and Operation of the Kanowna Belle Milling Circuit, SAG 1996, Pages 81-96.
Paper describes the design criteria for the circuit and one survey.
Design Criteria
The reported mill conditions during the survey are,
- throughput: 170 tonnes/hour
- SAG feed size, F80: 150 mm
- BM cyclone product size, P80: 71 µm
- SAG: 2134 kW power draw at mill shell (ESAG = 12.6 kWh/t)
- Ball mill: 1649 kW power draw at mill shell (Eball = 9.70 kWh/t)
- transfer size: 300 µm
The pebble crusher isn't described, assume it is a 7-foot cone crusher with 300 HP motor drawing 168 kW (Epeb = 1.0 kWh/t). Total circuit specific energy consumption Etotal is 23.2 kWh/t.
Several samples are given in the text. It is assumed that the survey period looks similar to "Lowes West", the 'median' hardness sample of the non-oxidized samples. The Lowes West sample gives similar predictions to the "Pilot Plant" sample tested at A.R. MacPherson, which is claimed to have been selected to be representative of the sulphides.
Lowes West sample {pilot plant sample}:
- WiC 26.7 (metric) {not tested}
- WiRM 22.7 (metric) {19.3 metric}
- WiBM 16.1 (metric) {18.3 metric}
Density isn't given, assume 2.7 t/m3
Modelling, mill power draw
Adjust the SAG and ball mill models to get the shell power draws reported in the paper. Actual conditions don't matter because there isn't enough detail to properly model the mills -- treat them just as sources of output kW.
Modelling, Optimized Bond/Barratt SABC model
The Lowes West sample is predicted to have Essbm of 22.3 kWh/t, add 10% to give Etotal prediction of 24.6 kWh/t. Based on the split of SAG + BM power, the T80 needed to balance the circuit is about 1370 µm. The 'pilot plant' sample predicts a T80 prediction of 540 µm and an Etotal of 26.8 kWh/t.
| Survey | Model, Lowes West sample |
Difference | Model, Pilot Plant sample |
Difference | |
|---|---|---|---|---|---|
| ESAG | 12.55 kWh/t | 13.27 kWh/t | +5.7% | 14.49 kWh/t | +15.4% |
| Eball | 9.70 kWh/t | 10.24 kWh/t | +5.6% | 11.19 kWh/t | +15.4% |
| Epeb | 0.99 kWh/t | 1.04 kWh/t | +5.2% | 1.14 kWh/t | +15.4% |
| Etotal | 23.24 kWh/t | 24.55 kWh/t | +5.6% | 26.82 kWh/t | +15.4% |
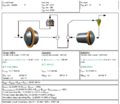
Screenshot of the Model, Lowes West sample
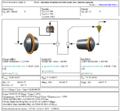
Screenshot of the Model, Pilot Plant sample


Modelling, Raw Bond/Barratt SABC model
The Lowes West sample is predicted to have Etotal of 29.1 kWh/t. Based on the split of SAG + BM power, the T80 needed to balance the circuit is about 530 µm. The 'pilot plant' sample predicts a T80 prediction of 377 µm and an Etotal of 29.5 kWh/t.
| Survey | Model, Lowes West sample |
Difference | Model, Pilot Plant sample |
Difference | |
|---|---|---|---|---|---|
| ESAG | 12.55 kWh/t | 15.70 kWh/t | +25.1% | 15.93 kWh/t | +26.9% |
| Eball | 9.70 kWh/t | 12.12 kWh/t | +24.9% | 12.30 kWh/t | +26.8% |
| Epeb | 0.99 kWh/t | 1.23 kWh/t | +24.5% | 1.25 kWh/t | +26.5% |
| Etotal | 23.24 kWh/t | 29.05 kWh/t | +25.0% | 29.48 kWh/t | +26.8% |
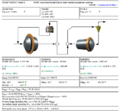
Screenshot of the Model, Lowes West sample
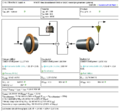
Screenshot of the Model, Pilot Plant sample


Discussion
The rod mill work index values in this survey were based on results from Amdel which is believed to have used a non-standard rod mill using a smooth liner. Bond rod mill work index determinations are supposed to be done in a mill employing a wave liner. The "pilot plant" sample rod mill work index was determined at the A.R. MacPherson - Hazen laboratory in the USA which has a wave liner. The ratio of WiRM:WiBM for the Pilot Plant sample (1.05) is dramatically different from the ratio for the samples tested in Australia (avg 1.40). In spite of this, the Lowes West sample, which is an "average sulphide" sample for Kawnowna Belle, gives similar throughput predictions to the Pilot Plant sample.
The predicted phantom cyclone effect is very significant, depending upon which sample is used for the "laboratory" work index value:
- for the Lowes West sample, WiO is 30% less than laboratory value
- for the Pilot Plant sample, WiO is 20% less than laboratory value
The pilot plant's 20% reduction is large, but believable. The Lowes West sample is too large, suggesting the ratio of WiRM:WiBM isn't really that representative of the plant feed during the survey.
The transfer size observed is very fine, 300 µm. The Raw Bond/Barratt model prediction is closer to the observed value (530 µm versus 1370 µm). Measured transfer sizes will always be finer than the "Bond-type" transfer sizes used in the model due to the extra fines present in the SAG product (the phantom cyclone effect). The difference between the survey and the Raw Bond/Barratt model could possibly be explained by the extra fines, but the difference versus the Optimized Bond/Barratt is probably too great to explain by fines correction alone. The 'pilot plant' sample, where the ratio of rod mill work index to ball mill work index is more "normal" gives an Optimized Bond/Barratt T80 prediction of 540 µm which is much closer to the survey than the Lowes West sample. The Raw Bond/Barratt model also gives a very fine T80 prediction on the Pilot Plant sample.
Overall, it appears that the Lowes West sample total energy prediction is close to what was observed during the survey, but the ratio of the rod mill and ball mill work index values (1.4) is probably not correct. The ratio observed in the pilot plant (1.05) give a better match to the internal model parameters (T80, phantom cyclone effect) even though the total hardness of the pilot plant sample exceeds that observed in the survey.