Benchmarking: Bond - Fort Knox
Contents
Benchmarking: Bond/Barratt - Fort Knox
- Magnuson, R.; Hallow, J.; Mosher, J.; Major, K., The Fort Knox Mill: Design, Commissioning and Operation. Proceedings of the SAG 2001 Conference, Vancouver, Canada.
Checking the July 1999 survey against the Bond/Barratt model for SAB circuit.
Some additional data available in Hollow, J and Herbst, J., Attempting to quantify improvements in SAG liner performance in a constantly changing ore environment, Proceedings of the SAG 2006 Conference, Vancouver, Canada.
Circuit Description and Inputs
The paper is believed to report power and specific power consumption values relative to the plant DCS. It is assumed that the DCS measurement happens at the motor input leads; the conversion of DCS to shell power for synchronous motors with pinions is 0.960 × 0.985 = 0.9456.
- Work index for ball milling=13.67 kWh/t (12.4 kWh/st);
- Work index for rod milling=12.02 kWh/t (10.9 kWh/st);
- assume Work index for crushing=10 kWh/t (similar to pilot plant samples).
- Feed F80 size= 106 mm
- Product P80 size= 178 µm
- Measured Etotal= 10.5 kWh/t relative to shell (10.1 kWh/st relative to DCS)

Mill power draw is given in both Tables 4 and 6. It appears that the units in Table 4 are incorrect, and the SAG and ball mill power draw values appear to be kW, and not horsepower as stated. The power draw values from Table 6 are:
- Measured SAG mill power draw= 8,910 kW (11,950 hp).
- Assumed to be DCS indication.
- Modelled conditions to match power draw: balls=16.5% v/v; filling=31% v/v; speed=75% c/s; 6" liner.
- Measured Ball mill power draw= 10,330 kW (13,850 hp, sum of two mills or 5165 kW/6925 HP each).
- Assumed to be DCS indication.
- Modelled conditions to match power draw: filling=27.5% v/v; speed=72% c/s; 6" liner.
- Measured throughput= 1733 t/h (1910 st/h)
Circuit operating work index is given in the paper as 13.4 kWh/st, which would convert to 14.0 kWh/t at mill shell. Checking the math:

Reorganize to solve for WiO:
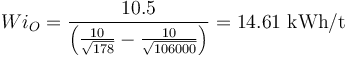
- Circuit operating work index to use for benchmarking is 14.6 kWh/t
Default Model Results

- Using 10% Essbm contingency (default for SABC circuit).
- Bond/Barratt model Etotal= 11.43 kWh/t (model 9% high)
- Bond/Barrat model WiO= 15.9 kWh/t (model 9% high)
- Bond/Barratt model throughput= 1607 t/h (model 7% low)
Result for default model conditions:
| Etotal | WiO | Tonnage | |||
|---|---|---|---|---|---|
| Model | 11.43 | 15.90 | kWh/t | 1,607 | t/h |
| Measured | 10.50 | 14.61 | kWh/t | 1,733 | t/h |
| Difference | 0.93 | 1.29 | kWh/t | 126 | t/h |
| Difference | 8.9% | 8.8% | 7.3% |
Model Tuning
The Bond/Barratt model is tuned using a calibration factor on the Single Stage Ball Mill specific energy consumption estimate (Essbm).
- Calculated Essbm = 10.39 kWh/t
- Measured Etotal = 10.50 kWh/t
- Model calibration factor = 1%