Benchmarking: Bond/Barratt - Selbaie
Contents
Benchmarking: Bond/Barratt Specific Energy Consumption - Selbaie
Duval, L. and Wood, K., Testing, Design and Operation of SAG Circuit at Les Mines Selbaie, Proceedings of the SAG 1989 Conference, Vancouver, Canada, September 1989.
Wood, K. and Duval, L., Mill Expansion at Les Mines Selbaie, Proceedings of the 25th Anniversary Issue of the Canadian Mineral Processors, Ottawa, Canada (Paper № 8), January 1987.
Model Criteria
Two surveys was conducted in Nov 1988 and Dec 1988 and reported the following:
- Ore laboratory Bond rod mill work index: 16.5 metric
- Ore laboratory Bond ball mill work index, 104 µm closing mesh: 12.2 metric
- Ore laboratory Bond ball mill work index, 37 µm closing mesh: 13.2 metric
- MacPherson Autogenous work index (gross) of 20.1 metric (to 332 µm)
- MacPherson Autogenous work index (corrected) of 15.8 metric (to 332 µm)
- MacPherson ball mill operating work index of 13.8 metric (to 48 µm)
- MacPherson AB circuit operating work index of 16.1 metric (to 48 µm)
- Laboratory results were similar to the "ABCD" sample used as the plant design basis.
- Circuit FAG mill feed F80 117 mm
- Circuit transfer size T80 325 µm
- Circuit cyclone overflow P80 44 µm
- Circuit SAG operating work index of 20.0 metric (to 325 µm)
- Circuit ball mill operating work index of 13.8 metric (to 45 µm)
- Circuit total operating work index of 16.0 metric (117 mm to 45 µm)
- Target throughput: 5000 t/d at 90% availability (231 t/h)
- Actual throughput: 5444 t/d at 93.5% availability (243 t/h)
The motors are described as:
- SAG mill is gear-driven with a DC variable speed motor having electrical efficiency of 0.925.
- SAG mill maximum speed (for "design" ore hardness) is 74% of critical speed.
- Ball mill is gear-driven with a fixed-speed synchronous motor (assume 0.96 electrical efficiency)
Additional data:
- SAG mill dimensions are given as 27 ft diameter by 11 ft long (not clear if this length is f/f or EGL)
- Checking the Metso installation list, a 27 ft by 12 ft f/f long SAG mill was delivered to Quebec in 1985.
- Duval & Wood (1989) say the discharge chamber is smaller than normal, so model a 10.5 ft EGL mill.
- Liner drawings show SAG mill hi/lo pattern with roughly 6 inch effective thickness.
- Ball mill dimensions are given in Wood & Duval (1987) as 16.5 ft diameter by 25.5 ft (doesn't say f/f)
- Checking the Metso installation list, a 16.5 ft by 25.5 ft f/f long ball mill was delivered to Quebec in 1985.
- SAG mill is normally operated at 8% v/v ball charge.
Additional model parameters
No crushing work index is provided, but we can make an assumption it is similar to the MacPherson Autogenous Work Index measured at Hazen.
- use WiC = 15.8 metric for modelling
The ball mill work index P80 values are not provided (only the closing mesh sizes) so a detailed ball mill Wi calibration to P80 cannot be performed. The target 44 µm will be somewhere between the expected test P80s of 73 µm and 105 µm closing meshes. Given the difference in work index is low (1.0 metric units), just model the arithmetic average of the two WiBM tests.
- use WiBM = 12.7 metric for modelling
No power draw numbers or mill filling values are given for the SAG or ball mill; only specific energy and work index values are provided. Assume for modelling:
- SAG mill filling is 25% v/v (gives about 85% of total power draw, sounds reasonable)
- ball mill filling is 32% v/v (gives about 95% of total power draw, sounds reasonable)
Duval & Wood do not specifically say if the reported work index values are relative to the motor output power (mill shell) or the measured DCS motor input power. Given that the paper does provide motor efficiency values and that comparisons to laboratory work index tests (which are based on motor output "pinion" power), it is reasonable to assume that the reported operating work index values are corrected to either the motor output or the mill shell. For purposes of comparison, we will assume the operating work index is equivalent to the "mill shell" specific energy values in SAGMILLING.COM; possibly predictions are low by 1.5% due to pinion mechanical efficiency).
Circuit Simulation
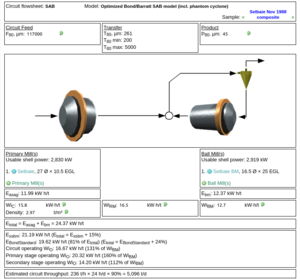
Combining the Bond/Barratt specific energy model, the Austin SAG model and the Nordberg wet overflow ball mill model results in the following throughput predictions using the work index values above:
| SAG | BM | total | |
|---|---|---|---|
| Predicted specific energy consumption, kWh/t | 11.99 | 12.37 | 24.37 |
| Predicted operating work index, metric | 20.3 | 14.2 | 16.7 |
| Measured operating work index, metric | 20.0 | 13.8 | 16.0 |
| Difference, metric Wi units | 0.3 | 0.4 | 0.6 |
| Difference, % | 2% | 3% | 4% |
